How I Freed a Researcher from Copy-Paste Hell
A client showed me the most tedious part of her work.
With Claude Code, I built a tool to give her time back.
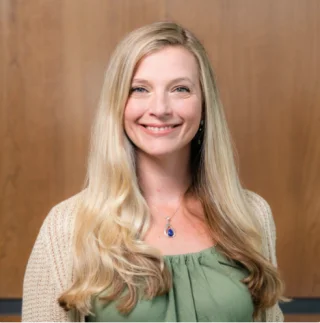 Elizabeth “Liz” Baker Professor, University of Alabama at Birmingham
Every time the analysis changes, I rebuild the same tables by hand.
Where Liz started
Elizabeth “Liz” Baker is a professor at the University of Alabama at Birmingham. She helps biomedical researchers design studies and make sense of their data.
She already used Claude for research and presentations but often struggled to find her previous work among “a million and one chats on the exact same thing.”
For an upcoming presentation, I helped her set up a Claude Project to keep related chats, files, and instructions together. She called it a “giant game changer.”
One “small” change means doing it all over again
From there, I asked Liz about the repetitive computer work that makes her think, “I got a PhD for this?”
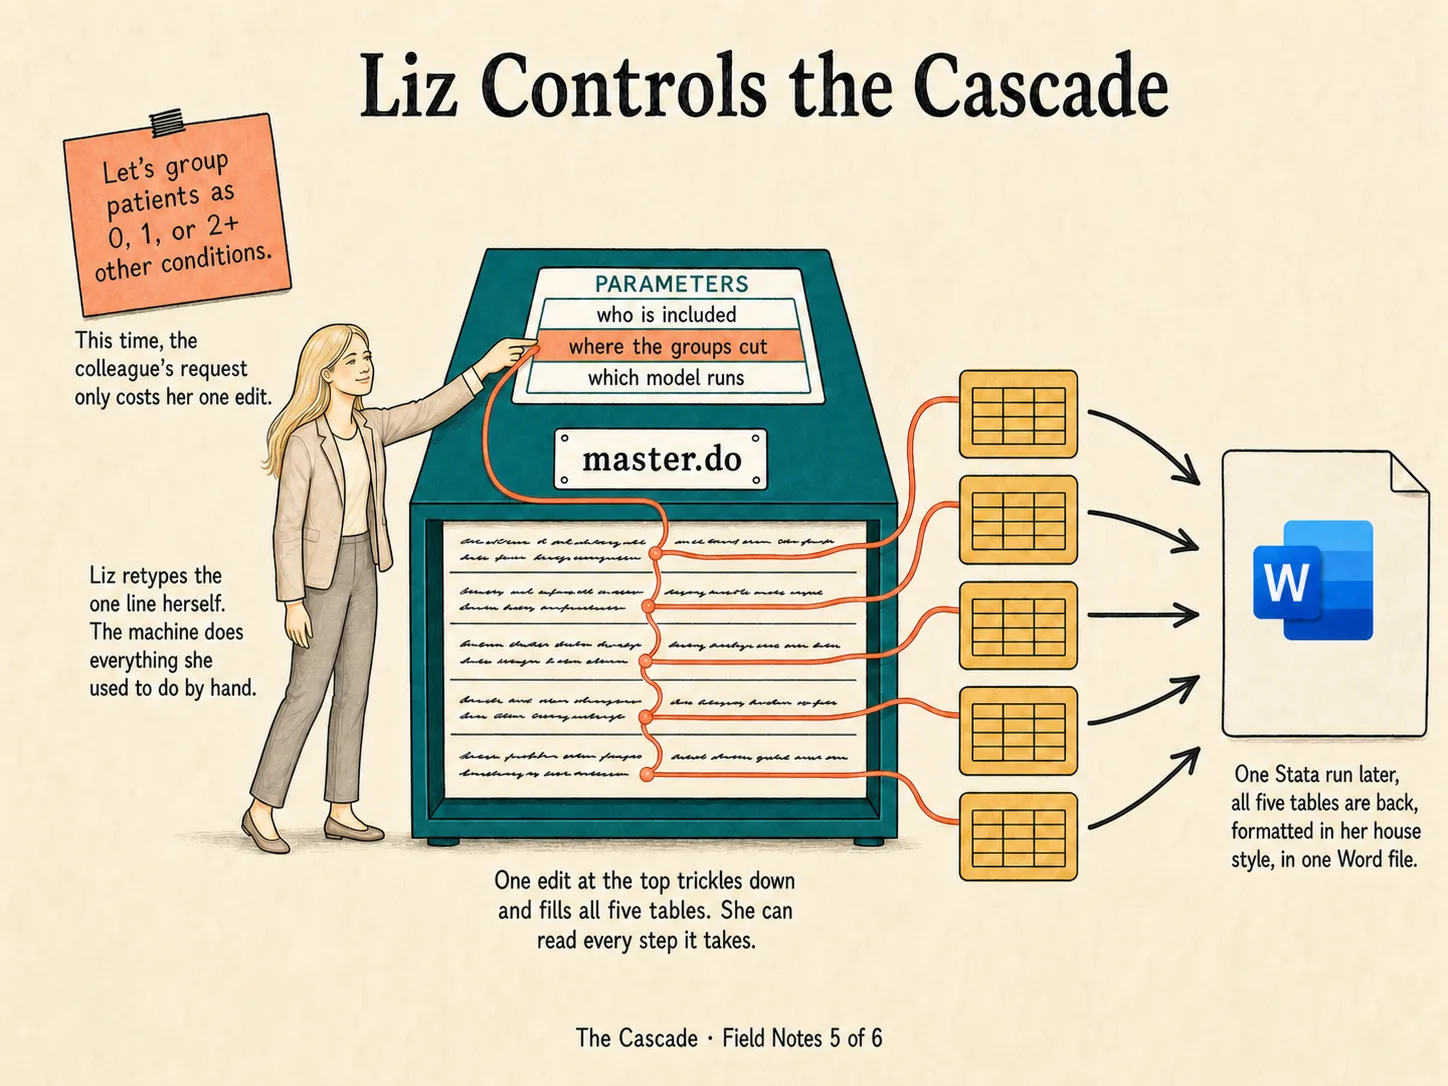
She showed me what a “small” request from a collaborator might involve, like adjusting the age cutoff for patients included in an analysis. That change meant rebuilding every affected table in a research paper by hand.
I watched her rerun an analysis in Stata, her statistical software, feed the results into Claude, copy a single table into Word, fix the formatting, check the numbers, then repeat the process, table after table. It was pure grind, and every manual edit was another chance to introduce an error.
Building a way out
I’m not a statistician, but I couldn’t accept that someone with Liz’s skills had to spend her time on this.
I gathered our session recordings and notes, Liz’s sample Stata code, and papers with her preferred formatting. I fed that context to Claude Code (Anthropic’s coding tool) with a goal: let Liz change a setting, rerun the analysis, and automatically update all affected Word tables.
I worked through Claude Code’s follow-up questions with Liz. It built the tool, and I tested it in Stata.
Liz tests the prototype
By our fourth coaching session, I had a working prototype to share. I was relieved to see Liz making sense of the Stata code, even though it was mostly Greek to me.
She immediately tried to create a comparison table that went beyond the samples I’d used to build the prototype. She changed the code to run two analyses, but only one set of results appeared in Word.
Liz told me exactly what was missing. “Put those words right into Claude,” I nudged her. She reviewed Claude’s revised code and ran it again. This time, both sets of results appeared side by side. In her first session with the tool, she had already taught it a new trick!
From prototype to real research
When we spoke again, Liz described using the tool for research on community-acquired pneumonia in children. She said a table that would take her about an hour to format by hand could now be generated with a click.
Looking back at her previous year’s workload, she estimated the tool would have saved her at least five hours a week.
With Liz’s encouragement, I made a general-purpose version and released the code publicly so other researchers could use and adapt it.